Creep
Creep is the progressive accumulation of plastic strain in a component under stress at an elevated temperature over a period of time. All creep modelling requires data that is unique to the material undergoing creep since all materials behave differently. This data may be stress, temperature, and time to failure data, or it may be material constants which are derived from the former. This secion of reliability contains two functions to determine time to failure due to creep. These functions are creep_rupture_curves and creep_failure_time. Creep is generally modelled using the Larson-Miller relation or the Manson-Haferd relation.
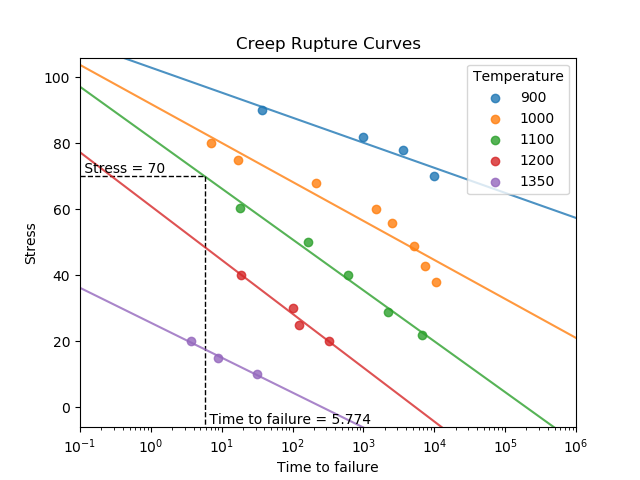
The function creep_rupture_curves plots the creep rupture curves for a given set of creep data. The function also fits the lines of best fit to each temperature. The time to failure for a given temperature can be found by specifying stress_trace and temp_trace.
API Reference
For inputs and outputs see the API reference.
Example 1
In the following example (taken from example 2.16 of Probabilistic Physics of Failure Approach to Reliability (2017)), we provide creep data in the form of temperatures, stresses, and times to failure in order to obtain the creep rupture curves. We also are interested in the time to failure of a component at a stress of 70 and a temperature of 1100.
from reliability.PoF import creep_rupture_curves
import matplotlib.pyplot as plt
TEMP = [900,900,900,900,1000,1000,1000,1000,1000,1000,1000,1000,1100,1100,1100,1100,1100,1200,1200,1200,1200,1350,1350,1350]
STRESS = [90,82,78,70,80,75,68,60,56,49,43,38,60.5,50,40,29,22,40,30,25,20,20,15,10]
TTF = [37,975,3581,9878,7,17,213,1493,2491,5108,7390,10447,18,167,615,2220,6637,19,102,125,331,3.7,8.9,31.8]
creep_rupture_curves(temp_array=TEMP, stress_array=STRESS, TTF_array=TTF, stress_trace=70, temp_trace=1100)
plt.show()
The function creep_failure_time uses the Larson-Miller relation to find the time to failure due to creep. The method uses a known failure time (time_low) at a lower failure temperature (temp_low) to find the unknown failure time at the higher temperature (temp_high). This relation requires the input temperatures in Fahrenheit. To convert Celsius to Fahrenheit use \(F = C\times(9/5)+32\). Also note that the conversion between Fahrenheit and Rankine used in this calculation is \(R = F+459.67\).
API Reference
For inputs and outputs see the API reference.
Example 2
In the following example (which follows on from the previous example), we will use the Larson-Miller relation to find the time to failure due to creep at 1100°F for a component which we know fails at 9878 hours when subjected to the same stress at 900°F.
from reliability.PoF import creep_failure_time
creep_failure_time(temp_low=900,temp_high=1100,time_low=9878)

'''
Results from creep_failure_time:
The time to failure at a temperature of 1100 °F is 8.27520045913433
The Larson-Miller parameter was found to be 32624.83162890552
'''
References:
Probabilistic Physics of Failure Approach to Reliability (2017), by M. Modarres, M. Amiri, and C. Jackson. pp. 81-90