Rank Adjustment
API Reference
For inputs and outputs see the API reference.
The Rank Adjustment estimator provides a method by which to estimate the survival function (reliability function) of a population without assuming that the data comes from a particular distribution. Due to the lack of parameters required in this model, it is a non-parametric method of obtaining the survival function. With a few simple transformations, the survival function (SF) can be used to obtain the cumulative hazard function (CHF) and the cumulative distribution function (CDF). It is not possible to obtain a useful version of the probability density function (PDF) or hazard function (HF) as this would require the differentiation of the CDF and CHF respectively, which results in a very spikey plot due to the non-continuous nature of these plots.
The Rank Adjustment estimator is very similar in result (but quite different in method) to the Kaplan-Meier estimator and Nelson-Aalen estimator. While none of the three has been proven to be more accurate than the others, the Kaplan-Meier estimator is generally more popular as a non-parametric means of estimating the SF. Confidence intervals are provided using the Greenwood method with Normal approximation.
The Rank Adjustment estimator can be used with both complete and right censored data. This function can be accessed from reliability.Nonparametric.RankAdjustment. The Rank-adjustment algorithm is the same as is used in Probability_plotting.plotting_positions to obtain the y-values for the scatter plot. As with plotting_positions, the heuristic constant “a” is accepted, with the default being 0.3 for median ranks.
Example 1
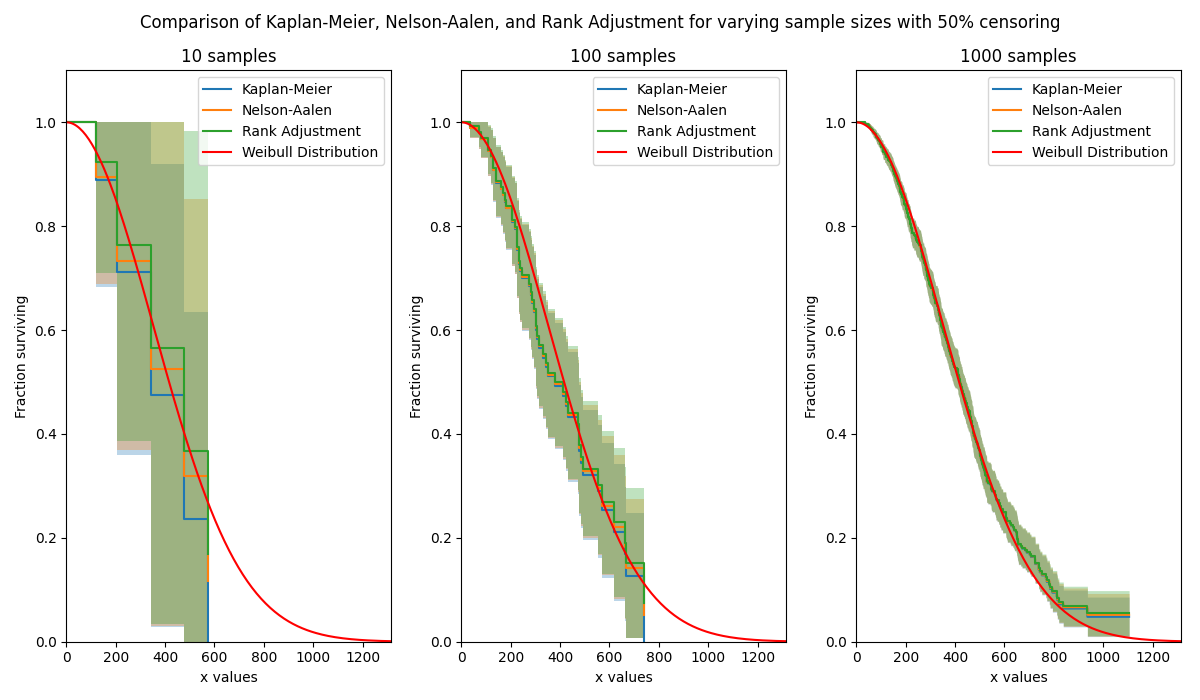
In this first example, we will see how Rank Adjustment compares with Kaplan-Meier and Nelson-Aalen for a large censored dataset. The plots show these three methods arrive at a similar result, with Kaplan-Meier giving the lowest estimate of the survival function, followed by Nelson-Aalen, and finally Rank-Adjustment. Note that this is when the median ranks are used in the Rank Adjustment heuristic. As sample size is increased, the differences between the three methods reduces.
import matplotlib.pyplot as plt
from reliability.Other_functions import make_right_censored_data
from reliability.Nonparametric import KaplanMeier, NelsonAalen, RankAdjustment
from reliability.Distributions import Weibull_Distribution

dist = Weibull_Distribution(alpha=500, beta=2)

plt.figure(figsize=(12, 7))
samples = [10, 100, 1000]
for i, s in enumerate(samples):
    raw_data = dist.random_samples(number_of_samples=s, seed=42)
    data = make_right_censored_data(data=raw_data, fraction_censored=0.5, seed=42)  # this will multiply-censor 50% of the data
    plt.subplot(131 + i)
    KaplanMeier(failures=data.failures, right_censored=data.right_censored, print_results=False, show_plot=True, label='Kaplan-Meier')
    NelsonAalen(failures=data.failures, right_censored=data.right_censored, print_results=False, show_plot=True, label='Nelson-Aalen')
    RankAdjustment(failures=data.failures, right_censored=data.right_censored, print_results=False, show_plot=True, label='Rank Adjustment')
    dist.SF(label='Weibull Distribution', color='red')
    plt.title(str(str(s) + ' samples'))
    plt.legend()
plt.suptitle('Comparison of Kaplan-Meier, Nelson-Aalen, and Rank Adjustment for varying sample sizes with 50% censoring')
plt.tight_layout()
plt.show()
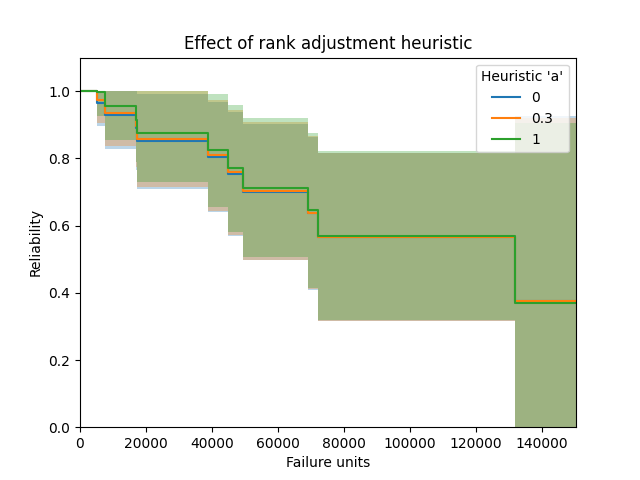
Example 2
In this second example we will look at the effect of the plotting heuristic “a”. The default heuristic used is 0.3 which gives the median ranks, but there are many other heuristics available by varying a from 0 to 1. Here we will look at the effect of setting “a” to be 0, 0.3, and 1. The effect is fairly minimal, though there is a small difference (which reduces as sample size increases) leading to the use of different heuristics. The median ranks (a=0.3) is most popular and is the default in most reliability engineering software for obtaining the plotting positions.
from reliability.Nonparametric import RankAdjustment
import matplotlib.pyplot as plt

f = [5248, 7454, 16890, 17200, 38700, 45000, 49390, 69040, 72280, 131900]
rc = [3961, 4007, 4734, 6054, 7298, 10190, 23060, 27160, 28690, 37100, 40060, 45670, 53000, 67000, 69630, 77350, 78470, 91680, 105700, 106300, 150400]
a_trials = [0, 0.3, 1]
for a in a_trials:
    RankAdjustment(failures=f, right_censored=rc, print_results=False, a=a, label=str(a))
plt.legend(title="Heuristic 'a'")
plt.title('Effect of rank adjustment heuristic')
plt.show()