ROCOF
Rate of occurrence of failures (ROCOF) is used to model the trend (constant, increasing, decreasing) in the failure interarrival times. For a repairable system, we want the ROCOF to be improving (failure interarrival times to be increasing). As failure times can often appear quite random, it is necessary to conduct a statistical test to determine if there is a statistically significant trend, and if there is a trend we can then model that trend using a Power Law NHPP. The test for statistical significance is the Laplace test which compares the Laplace test statistic (U) with the z value (z_crit) from the standard Normal Distribution. If there is a statistically significant trend, the parameters of the model (Lambda_hat and Beta_hat) are calculated. By default the results are printed and a plot of the failure interarrival times and MTBF is plotted.
API Reference
For inputs and outputs see the API reference.
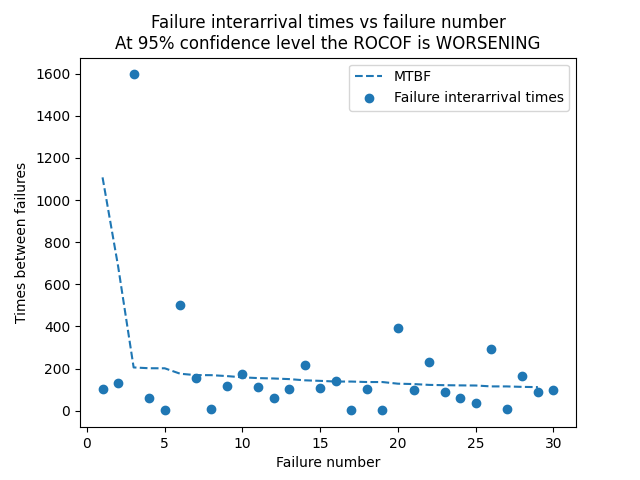
In the example below, we provide the failure interarrival times. The function will run the Laplace test using the default 95% confidence interval and then, when a trend is found, it will plot the MTBF based on the calculated NHPP Power Law model. MTBF = 1/ROCOF. This example is based on Example 5.11 (p275) from Reliability Engineering and Risk analysis listed in the recommended resources.
from reliability.Repairable_systems import ROCOF
import matplotlib.pyplot as plt
t = [104,131,1597,59,4,503,157,6,118,173,114,62,101,216,106,140,1,102,3,393,96,232,89,61,37,293,7,165,87,99]
ROCOF(times_between_failures=t)
plt.show()

'''
Results from ROCOF analysis:
Laplace test results: U = 2.409, z_crit = (-1.96,+1.96)
At 95% confidence level the ROCOF is WORSENING. Assume NHPP.
ROCOF assuming NHPP has parameters: Beta_hat = 1.588 , Lambda_hat = 3.703e-05
'''