Changelog
Version: 0.9.0 — Released: 7 Mar 2025
Summary of changes
This is a major release. After 14 months of no updates, this release is essential to fix issues with dependency compatability, mainly with scipy. More frequent updates are planned in the near future.
Bug Fixes
Issues 51 and 54 have been resolved by updating “simps” to “simpson” from scipy.
Issue 55 has been resolved. There was a bug that occurred in the plots for Fitters.Fit_Everything when all the failure times were small numbers (~0.01).
Issue 49 has been resolved. There was a bug with Mixture, Competing Risks, and DSZI models for the quantile and inverse_SF methods that did not accept array like inputs. This was resolved by changing the method used to find these values to interp.
Other
Requirements for all the dependencies have been updated to the most recent releases.
Tests have been updated to reflect the slightly more accurate results when issue 49 was fixed.
Version: 0.8.16 — Released: 27 Dec 2023
Summary of changes
This is a minor release to fix two bugs. The first bug was in plot legend for PoF.SN_diagram which had the confidence intervals hardcoded to 95%. The legend now reflects the specified CI. The second bug was from this issue where the Lognormal Distribution CDF didn’t return a tuple. This is now fixed and aligns with the remainder of the distributions. A few broken hyperlinks in the docs have also been fixed.
Version: 0.8.15 — Released: 31 Oct 2023
Summary of changes
This is a minor release to add the ability to use Mixture_Model and Competing_Risks_Model as distributions in Other_functions.stress_strength. There is also a minor bugfix to allow Loglogistic distributions with beta<1 to be used. The bug occurred because a text string was created for the mean of a Loglogistic distribution with beta<1 (since there is no mean for such distributions) and the mean was used for a calculation causing an error. The calculation works equally well using the median which does exist for these distributions. Thanks to Cole Tenold for raising this issue.
Version: 0.8.14 — Released: 07 Oct 2023
Summary of changes
This is a minor release to fix a bug in Other_functions.stress_strength and Other_functions.stress_strength_normal. The bug occurred when stress was greater than strength causing the integration to fail and return incorrect values for the probability of failure. This has been fixed and the plots are also improved. Thanks to github user ctenold for identifying this issue and providing a working solution. There is also a speed improvement for Fitters.Fit_Weibull_2P_grouped which takes advantage of the np.repeat function to optimize the process of generating the arrays for large datasets of repeating values. Thanks to Tomas Santos for identifying this improvement.
Version: 0.8.13 — Released: 02 Sep 2023
Summary of changes
This is a minor release to fix a bug in the plot of Reliability_testing.chi2test identified in this issue. The normed parameter in numpy.histogram is deprecated and had been replaced by the density parameter.
Version: 0.8.12 — Released: 02 Aug 2023
Summary of changes
This is a minor release to fix a bug in the plot of Nonparametric.RankAdjustment identified in this issue. The values weren’t being sorted. This has been fixed by adding an optional ‘sort’ argument to Probability_plotting.plotting_positions.
Version: 0.8.11 — Released: 07 Jul 2023
Summary of changes
This is a minor release to remove the docutils requirement. There was a bugfix in docutils and an update to sphinx so we no longer need to specify docutils<0.18.
Version: 0.8.10 — Released: 15 May 2023
Summary of changes
This is a bugfix release.
Bug Fixes
Requirements needed to be updated. Specifically some changes in pandas 2.0.0 needed to be promulgated to reliability so it is no longer compatible with earlier versions of pandas.
Version: 0.8.9 — Released: 23 Apr 2023
Summary of changes
This is a bugfix release.
Bug Fixes
There was a bug in Competing Risks and Mixture Models which occurred when the PDF or HF had an asymptote, resulting in an error from matplotlib. Values that are almost inf have been capped to 1e100 to prevent overflow in matplotlib.
A change to the python core across mutliple versions resulted in key value pairs from iterators returning the key as a tuple rather than a float. This only affected ALT Fitters and caused all of them to fail. Within Utils the key float is now extracted from the key tuple to resolve this bug.
Other
Added PDF and EPUB downloads in readthedocs.
Version: 0.8.8 — Released: 21 Feb 2023
Summary of changes
This is a bugfix release.
Bug Fixes
API changes in matplotlib which deprecated some keywords and axes classes resulted in two serious bugs being introduced into reliability. This has been fixed and the requirements for matplotlib have been updated to >=3.7.0.
Version: 0.8.7 — Released: 28 Jan 2023
Summary of changes
This is primarily a bugfix release, with some minor API changes and new features.
New features
Reliability_testing.likelihood_plot is a new function to generate a likelihood plot. See the documentation for more detail.
API Changes
Utils.round_to_decimals has been replaced by Utils.round_and_string. This function always returns a string and the rounding rules applied are better than before as they apply scientific notation for very large and very small numbers. This was an issue in plot titles and plot text where very large numbers weren’t being displayed in scientific notation.
Within Fitters and Distributions that have been created by Fitters, the confidence intervals can be turned off using CI_type=’none’. Previously this was CI_type=None which caused some issues with confidence interval inheritance between Fitters and Distributions and an inability to turn them off when called from Distributions.
Utils.life_stress_plot will swap the x and y axes if ax=’swap’. This is useful for making a stress-life plot which is similar to an SN_diagram.
All of the ALT_Fitters will now accept show_life_stress_plot=’swap’ to return a stress-life plot by swapping the axes of the standard life-stress plot.
Bug Fixes
The axes limits for the histogram plot in Fit_Everything crashed when a left asymptote occurred.
KStest and chi2test now accept Mixture Model, Competing Risks Model, and DSZI model for the distribution.
The line of best fit in life stress plots started at 1. This was a problem for data less than 1. The line of best fit now starts at 0.
When using force_beta with RRX in Fit_Weibull_2P, the beta that is returned is the inverse of force_beta. This only occurred for RRX for Fit_Weibull_2P. Thanks to Github user ctenold for identifying this bug and providing the solution in this issue.
Other
Added a new textbook to Recommended resources.
The CDF, SF, and CHF methods in Distributions did not include all the parameters in the documentation.
Version: 0.8.6 — Released: 06 Aug 2022
Summary of changes
This is primarily a bugfix release to deal with a few minor bugs and a few minor features have been added to make it easier to save figures programatically for later use.
New features
Fit_Everything and ALT_Fit_Everything now return figure handles for the figures. This behaviour is similar to each of the individual functions in Fitters and ALT_Fitters which return axes handles. This was done to allow the figures to be saved programatically for use later.
A new Utils function reshow_figure will reshow a figure that has been closed. The plot interactivity is lost due to an unresolved issue with matplotlib, but the function still allows a figure to be reshown from an axes or figure handle.
API Changes
The returned figure handles from Fit_Everything and ALT_Fit_Everything are available from the results. For example “results.probability_plot” will return the figure handle for the probability plot. The the API reference of Fit_Everything_ALT and Fit_Everything for details.
ALT_Fit_Everything now accepts 2 kwargs of failure_stress and right_censored_stress as alternatives to the arguments of failure_stress_1 and right_censored_stress_1. This is used to provide consistency with the other functions in ALT_Fitters which also accept failure_stress and right_censored_stress.
Bug Fixes
There was a floating point precision error in Distributions.Mixture_Model when the check for sum(proportions) was done. See this issue for details.
Mixture_Model and Competing_Risks_Model encountered an error when provided with a single value. This was due to two bugs: a type mismatch in the combiner sub function and an inability to iterate a single element array when trying to find the plotting limits if there is only a single value provided (solved by disabling plotting for this case). Thanks to Smita for identifying this bug.
Other
Minor optimisations to the probability plotting in ALT_Fit_Everything to merge a function that is only used once and did not need to be its own function.
Minor corrections to the docs and fixing a broken link.
Version: 0.8.5 — Released: 25 May 2022
Summary of changes
This is bugfix release to deal with a minor bug.
Bug Fixes
The equation for the Loglogistic Hazard function was wrong. It mistakenly used the equation for the Weibull Hazard Function. Fitted results are unaffected. This bug only affected the plot and numerical outputs of the Loglogistic Hazard Function. Thanks to Kaiya Raby for finding and reporting this bug.
Version: 0.8.4 — Released: 05 May 2022
Summary of changes
This is bugfix release to deal with a minor bug.
Bug Fixes
Weibull Mixture models and Weibull Competing Risks models obtain their initial guesses by splitting the data into two groups and fitting a Weibull distribution to each group. If there are not two distinct groups, the estimate for the dividing line between the two groups may result in one of the groups having fewer than 2 failures allocated to the group. This causes an error when fitting the Weibull distribution to that group. It has been fixed by checking the number of elements in the group and moving the dividing line if required. The dividing line is only an estimate used to obtain the initial guess for the parameters and the dividing line is not used in the final MLE or LS estimates in the fitter.
Version: 0.8.3 — Released: 17 Apr 2022
Summary of changes
This is bugfix release to deal with a minor bug.
Bug Fixes
When a distribution was fitted and the defaults for CI and CI_type were overridden, these new values should have been inherited by the distribution object. They were not causing the probability plot to always show confidence intervals with CI=0.95 and CI_type=’time’. This has been resolved so that the probability plot will use the values for CI and CI_type that the user specifies and the distribution object returned with the results will also inherit these values as defaults. The distribution object can still be used with any CI and CI_type but the defaults are now those which have been inherited from the values given to the fitter. This bug affected the plots generated by all fitters which display confidence intervals.
Other
Fixed a deprecation in pandas associated with df.append being replaced with pd.concat.
Version: 0.8.2 — Released: 23 Mar 2022
Summary of changes
This is bugfix release to deal with a minor bug.
Bug Fixes
When only 1 failure time was entered and the shape parameter was specified, the Anderson Darling calculation would crash due to receiving a float not an array. Thanks to Francois Besnard for reporting this. This is now resolved.
Version: 0.8.1 — Released: 18 Jan 2022
Summary of changes
This is bugfix release to deal with a minor bug.
Bug Fixes
The histogram plot in Fit_Everything had a bug which caused plotting to fail, as identified by this issue. This is now resolved.
Version: 0.8.0 — Released: 09 Jan 2022
Summary of changes
The major changes in this release include enabling confidence bounds to be extracted programatically from the distribution object, and a complete rewrite of the reliability_growth function. There are also several minor changes, mainly to the documentation and a minor bugfix.
New features
Extracting confidence bounds on CDF, SF, and CHF for bounds on time or bounds on reliability can now be done directly from the distribution object that is created by the fitter, as shown here. This required a large number of functions to be modified and resulted in several API changes (see below).
Repairable_systems.reliability growth has been completely rewritten. This function now includes both the Duane and Crow-AMSAA reliability growth models. The parametrisation of the Duane model has been modified to match what reliasoft uses.
New dataset called system_growth has been added to the Datasets module.
API Changes
Repairable_systems.reliability growth has been completely rewritten, so the inputs and outputs are completely different. The old version of the Duane model has been replaced without deprecation. Users needing to use the old version should use v0.7.1 of reliability.
All references to percentiles have now been replaced by quantiles. Note that the previous percentiles argument in the Fitters mandated values between 0 and 100. The quantiles argument mandates values between 0 and 1. They are otherwise the same, just a factor of 100 different. This has been changed without deprecation, so it may cause your code to break if you are using the percentiles argument. This change was made for simplicity, since the plots show quantiles so there was no real need to have a new argument for the same thing multiplied by 100.
The subfunctions (.CDF(), .SF(), .CHF()) for each Distribution (that has confidence intervals) now have all relevant arguments visible as args rather than kwargs. This refers to plot_CI, CI_type, CI, CI_y, CI_x. Previously plot_CI, CI_type, and CI were kwargs so your IDE would not show you these. They have been converted to args for ease of use. The arguments CI_x and CI_y are new, and are used to extract the confidence bounds from the plot of a fitted distribution object.
Bug Fixes
The ALT life stress plots for dual stress models now plot the scatter plot above the surface plot. This is enabled from matplotlib 3.5.0 onwards using the new parameter computed_zorder which respects the zorder specified rather than always plotting surfaces above scatter points.
Other
Improvements to the API documentation for Convert_data, Datasets, PoF, and Utils modules. This has been a long term body of work to reformat the documentation, and it is finally complete.
The required version of matplotlib has been upgraded to 3.5.0 to enable the above bugfix for the computed_zorder in ALT life stress plots.
Theory documents are finished for censored data, plotting positions, Least Squares Estimation, Maximum Likelihood Estimation, and Confidence Intervals.
Updates pytests for new reliability_growth function.
New document on working with fitted distributions.
Added several new utils functions including, distributions_input_checking, extract_CIs, unpack_single_arrays
Within the Distributions module, the returns from each PDF, CDF, SF, HF, CHF, quantile, inverse_SF function will automatically unpack arrays of length 1. This means that if given an array of length 1 as input, you will now get a float instead of an array as output. This makes it easier for users to avoid the need to manually unpack single values for later use.
Updated API documentation for Distributions to reflect the numerous changes to the inputs and outputs.
Version: 0.7.1 — Released: 26 Oct 2021
Summary of changes
This is primarily a bugfix release to deal with some minor bugs.
Bug Fixes
Other_functions.crosshairs returned the labels as a float which resulted in numbers like 10.0 rather than 10 when decimals=0. The labels are now converted to int when decimals=0 so they will indeed return zero decimals when told to.
PP_plot_parametric, PP_plot_semiparametric, QQ_plot_parametric, and QQ_plot_semiparametric all had a bug that would cause complete failure. This bug was caused by incorporating an argument that didn’t exist. Further details in this issue.
Other
Added a documentation section (Reliability Theory) which explains how some important algorithms work.
Made Fit_Everything more tolerant of different names to exclude distributions. For example to exclude the Weibull_CR model, users may type “Weibull_CR”, “CR”, “Weibull_Competing_Risks”, “Competing Risks” and many more variations.
Version: 0.7.0 — Released: 8 Oct 2021
Summary of changes
Version 0.7.0 has a few really useful enhancements. The first of these is the addition of three of the special models (mixture, competing risks, defective subpopulation) to the Fit_Everything function. The second major enhancement is faster plotting for large datasets using downsampling. There are also numerous bug fixes that resolve several longstanding minor issues as well as some minor changes that make some of the algorithms more reliable.
New features
Added Weibull_Mixture, Weibull_CR, and Weibull_DS to Fit Everything. This also required changes to the plot window sizes.
Changed the histogram plot from Fit_Everything. Legend is now on the left as it was getting too long with 15 items. New method used to scale the CDF histogram when there is censored data which is more accurate than the previous scaling method.
Downsampling for the scatter plot on probability plots. This makes plotting much faster for large datasets (>1000 failures), particularly when using Fit_Everything which has many subplots.
API Changes
The keyword “downsample_scatterplot” now appears in all fitters and probability plots. It controls whether the scatterplot will apply downsampling. This only affects the plot (when there are over 1000 data points) not the calculations.
Bug Fixes
Resolved Deprecation Warning from numpy in PoF.strain_life_diagram.
Fit_Everything had a bug when the best distribution was Weibull_Mixture, Weibull_CR, Weibull_DS due to these distributions not having param_title_long.
Probability plots with very large datasets (>10000 items) sometimes resulted in the upper ylim being 1. This is equivalent to infinity on a probability plot and caused an error. It is now manually corrected for.
The least squares method for Fit_Gamma_3P produced a very poor estimate due to a bug. This carried across into the MLE result since LS is used for the MLE initial guess.
The confidence intervals would sometimes not be displayed on probability plots with very small datasets. This was due to the CI arrays still containing 1’s at the extremities. This is now corrected using a more robust filter before plotting.
Numerous bug fixes for ALT_Fitters, including the ability to exclude distributions (which was previously being ignored due to an error) and greater stability in the initial guess (which previously could crash with some datasets due to non-invertable matrices).
Fixed a rare bug in all Fitters and all ALT_Fitters when the hessian matrix was non-invertable. This would cause a LinAlgError. Now it will be excepted and print a warning that the confidence intervals can’t be obtained.
Other
Changed the method used by curve_fit within least_squares. Previously was ‘dogleg’ which was very slow. Changed to ‘trf’. This significantly speeds up the location shifted distributions (Weibull_3P, etc.)
Changed the group splitting algorithm used in Fit_Weibull_Mixture and Fit_Weibull_CR. The new method is more robust and provides a better initial guess of the parameters for MLE.
Completed the reformatting of the API docs for all the ALT_Fitters. Still need to do this for the Convert_data, Datasets, PoF, Utils modules. Reformatted API docs for these remaining modules will be part of a future release.
Version: 0.6.0 — Released: 23 July 2021
Summary of changes
Version 0.6.0 has two main improvements. Firstly the behaviour of the optimizers has been changed to be more efficient, and to allow users to try multiple optimizers easily by specifying optimizer=’best’. Secondly, the addition of the Defective Subpopulation (DS) and Zero Inflated (ZI) Model now provides a model for which the CDF can range from above 0 to below 1. There are several new Fitters added to take advantage of this as detailed below.
New features
Ability to specify “best” optimizer will result in multiple optimizers being tried and the best result being used. Optimizers tried are “L-BFGS-B”, “TNC”, “powell” and “nelder-mead”. For more detail see the documentation on Optimizers.
DSZI_Model has been added to the Distributions module. This model allows for the CDF to start above 0 and finish below 1.
Fitters for DSZI models, including Fit_Weibull_DS, Fit_Weibull_ZI, Fit_Weibull_DSZI
API Changes
The optimizer “nelder-mead” will now be accepted as a bounded optimization method. This requires scipy 1.7.0 or higher.
Bug Fixes
Due to a new Utils function implemented in 0.5.7, a runtime error would occur when the confidence intervals could not be plotted due to too many NaNs in the arrays. This error has now been bypassed.
Other
The default optimizer has been changed. Previously it was ‘L-BFGS-B’ for < 97% censored data and ‘TNC’ above 97% censored data. Now it is ‘TNC’. For more detail and a flowchart description of the default behaviour, see the documentation on Optimizers.
The optimizer used is now reported in the printed results for all of the Fitters and ALT_Fitters.
Removed support for Python 3.6 due to scipy 1.7.0 dropping support for this Python version.
Change to the algorithm used in Other_functions.make_right_censored_data when making multiply censored data. The algorithm used is explained here.
Significant speed improvement to Other_functions.make_right_censored_data when making multiply censored data.
Change to the versioning system. The new system is major.minor.bugfix whereas the previous system was reserved.major.minor. This should allow more frequent bugfix releases.
Fixed all the tests for ALT_Fitters since this relied upon Other_functions.make_right_censored_data which had a change of algorithm
Speed improvement to Probability_plotting.plotting_positions to make it 7% faster.
Version: 0.5.7 — Released: 25 June 2021
Summary of changes
Version 0.5.7 of reliability completes a part of this project that has taken almost one year by providing confidence intervals for all standard distributions (except Beta_2P). This release now incorporates confidence intervals for the Gamma_2P and Gamma_3P distributions which were the last remaining to be implemented and proved quite a mathematical challenge. In addition to these enhancements, version 0.5.7 contains numerous minor bug fixes and API changes.
New features
Fit_Gamma_2P and Fit_Gamma_3P now have confidence intervals implemented. This involved changes to Distributions, Utils, Fitters, and Probability_plotting modules.
API Changes
Added “dateformat” argument to Other_functions.crosshairs. This provides datetime formatting capability for x axis crosshair labels and annotations. Useful if the plot contains datetime data on the x axis.
Fully deprecated Other_functions.convert_dataframe_to_grouped_lists
Fully deprecated the ALT_probability_plotting module as this was made redundant by the improvements to ALT_Fitters in v0.5.6
Fit_Weibull_Mixture and Fit_Weibull_CR didn’t accept kwargs. All kwargs are now passed directly to matplotlib making it possible to change color, label, linestyle, etc on the probability plot of these distributions.
In stress_strength and stress_strength_normal the argument show_distribution_plot has been changed to show_plot. This is done for simplicity and standardisation.
The outputs from all nonparametric functions (.KM, .RA, .NA) are now arrays. Previously these were lists.
Repairable_systems.optimal_replacement_time argument “show_plot” has been changed to “show_time_plot”. There is another argument “show_ratio_plot” which has been added. While normally expecting True/False, these arguments will also accept axes subclasses if you want them to plot on a specific axes.
All of the ALT_Fitters (except Fit_Everything_ALT) will now accept an axes object into their show_probability_plot and show_life_stress_plot arguments. If an axes object is passed, the plot will be added to the axes specified. This enables the plots to be placed in subplots rather than always being in their own figures.
Bug Fixes
Reliability_testing.reliability_test_planner had an error when solving for number of failures. It gave a number 1 more than it should. The number of failures should ensure the MTBF is always above the minimum requirement.
Incorrect formula for stress strength interference was used. This created negligible difference at small probabilities of failure but when stress.mean > strength.mean the difference was significant. Thanks to Jake Sadie for discovering this.
All fitters that extracted the covariance (eg. Cov_alpha_beta) took the abs value. This was incorrect as covariance can be negative. This may have led to minor errors in some of the confidence intervals on the plots as covariance is used for these confidence intervals.
Other_functions.distribution_explorer had a bug due to a change that matplotlib made to the type of error raised. This caused axes to be removed and not redrawn when the radio buttons were toggled. This has been fixed by hiding the axes rather than removing them.
CI_type of None was not being passed from Fitters resulting in an inability to hide the confidence intervals on the plot as the presence of None resulted in the default of ‘time’ being used. CI_type=None as a kwarg from fitters will now supress the confidence intervals in the probability plot.
Exponential_probability_plot and Exponential_probability_plot_Weibull_Scale now allow fitting with 1 failure. Previously required 2 failures. This change was made because Fit_Exponential_1P only requires 1 failure so the limitation was rule based not a mathematical limitation.
Minor fixes to how the confidence intervals are prepared to ensure the arrays are cleaned of illegal values caused by precision errors.
Other
Improvements to API documentation. This has been a long term work in progress, but is nearly finished.
Speed enhancement (x10) to Repairable_systems.optimal_replacement_time and the addition of a new plot (cost ratio vs replacement interval). Thanks to Ed Burrows for contributing the speed enhancement.
chi2test and KStest will no longer produce their own figure and show the plot automatically. This now enables the plot to be added to an existing figure as a subplot. If not part of a subplot the behaviour is unchanged except that you now need to use plt.show() to show the plot.
Version: 0.5.6 — Released: 7 March 2021
Summary of changes
Version 0.5.6 of reliability is focused on enhancing the accelerated life testing (ALT) section of the library. This release includes a complete rewrite of ALT fitters and supporting Utils, comprising around 13000 lines of code (about 28% of the total codebase). This is the biggest update in terms of lines of code for this library. The rewrite also includes new ALT models (bringing the total from 20 to 24) and tremendous speed enhancements. In addition to the rewrites done to ALT_fitters, there are numerous other small enhancements and bug fixes detailed below.
New features
Fitters.Fit_Everything now includes an option to show_best_distribution_probability_plot. Default is True.
Each of the functions within ALT fitters now has a goodness of fit dataframe printed with results.
Other_functions.make_ALT_data is a new function that enables ALT data to be created. This is useful for testing the functions within ALT_Fitters.
ALT fitters was sensitive to the initial guess as it used curve_fit. The initial guess has been changed to use least squares to obtain the initial guess since the stress-life equations are all linearizable.
ALT_fitters.Fit_Everything_ALT is a new function that enables users to fit all the ALT models.
ALT_fitters now has Dual_Power models, bringing the total available models to 24.
API Changes
The ALT_probability_plotting module has been deprecated. Functions will still run with a Deprecation Warning. This was done because all the functionality has been included in the new ALT_fitters module.
ALT_fitters functions have several changes to the inputs and outputs. Please see the documentation for detail of the new input and output arguments.
All the probability plots now have a new argument “show_scatter_points” which allows the scatter plot to be hidden if set to False. This was implemented based on this issue.
Bug Fixes
Failure to fit any of the ALT_fitters will now report the failure and run with the initial guess, rather than crashing.
make_right_censored_data used a seed but this seed was ineffective due to the use of both the random module and numpy.random. Changed to use only numpy.random so now the seed achieves repeatability.
ALT_fitters had incorrect confidence intervals for b in Exponential, a in Power, and c in Dual-Exponential
ALT_fitters Eyring models would crash if not given right_censored data.
Some ALT models didn’t accept data with < 2 failures at each stress level. The new requirement is to have at least as many failures as there are parameters in the model. It is possible to have a single failure at each stress level and still fit the model.
The percentiles dataframe in Fit_Weibull_3P had the first column set as the index. This has been corrected to retain the original index. Identified in this issue.
The function plotting_positions sorted the failure data and returned sorted lists. This made it difficult if users wanted to specify different colors for each of the points. plotting_positions now returns the results in the same order the input was given, as per this issue.
Some datasets with some optimisers could cause a crash due to a non-invertable hessian matrix. This error is now caught and a warning is issued about the confidence intervals without causing a crash.
Other
Minor improvement to scaling and text positions in stress_strain_diagram
CodeCov was broken when the continuous integration was changed from Travis_CI to GitHub Actions. CodeCov reporting is now fixed and the coverage will be improved upon progressively.
All the Fitters now return the axes handles in the probability_plot output object.
Started work on API documentation. This is already available using the help function in Python, but adding it to readthedocs makes it much easier to read.
Fit_Expon_1P and Fit_Expon_2P are now fully deprecated and have been removed. These were replaced by Fit_Exponential_1P and Fit_Exponential_2P in version 0.5.4 (released Nov 2020).
The Stress_strength module is now fully deprecated and has been removed. The functions from within this module were renamed and moved to the Other_functions module in version 0.5.5 (released Jan 2021).
Version: 0.5.5 — Released: 6 January 2021
Summary of changes
Version 0.5.5 of reliability has significant improvements to the initial guess methods for the Fitters functions. This makes all the fitters much faster and more accurate. There are also many new enhancements including functions to help with importing data from Excel and converting data between different formats. There are many bug fixes in this release. The other major change is in code formatting using Black.
New features
All of the standard fitters have been significantly improved with the following features:
Least Squares estimation is now available. Previously the fit was solely achieved using MLE. MLE remains the default.
For the least squares estimation, users may select RRX, RRY, LS. RRX and RRY are rank regression on X and rank regression on Y respectively. LS will perform both RRX and RRY and use the one with the best log-likelihood.
There are 3 optimisers to choose from for all of the standard fitters. These are L-BFGS-B, TNC, powell. Previously there was only an option for some of the fitters and the optimiser was not standardized. L-BFGS-B is default if there is less than 97% censored data, otherwise TNC is the default optimizer above 97% censored data.
Removal of scipy as the method to obtain the initial guess for MLE. With the inclusion of least squares estimation, the MLE method is much faster since it is not reliant on scipy to provide an initial guess (which failed to account for right censored data and often gave a poor guess).
Addition of a new module for converting data between different formats. The module reliability.Convert_data allows for conversion between FR (failures, right censored), FNRN (failures, number of failures, right censored, number of right censored), and XCN (event time, censoring code, number of events). It also provides a streamlined process for importing data from xlsx files, for exporting data to xlsx files, and for printing the dataset in a dataframe for easy visualisation.
API Changes
All of the standard fitters now include method and optimizer arguments.
The non-standard fitters (Fit_Everything, Fit_Weibull_Mixture and Fit_Weibull_CR) now include optimizer argument.
Fitters.Fit_Weibull_2P, Fitters.Fit_Weibull_3P, Fitters.Fit_Weibull_2P_grouped have had some changes to their input arguments so that they all include method and optimizer. The initial_guess_method option is gone as it has been replaced by least squares estimation.
The function Other_functions.Convert_dataframe_to_grouped lists is now deprecated. The functionality is captured within the new Convert_data module.
The entire Stress_strength module has been deprecated. This is because there were (and likely only ever would be) two functions in this module which is not enough to justify a separate module. The two function have been moved into Other_functions and renamed. Full deprecation will occur in March 2021 (in version 0.5.6), and until then a DeprecationWarning will be printed and the old functions will still work. The renaming is as follows:
reliability.Stress_strength.Probability_of_failure \(\Rightarrow\) reliability.Other_functions.stress_strength
reliability.Stress_strength.Probability_of_failure_normdist \(\Rightarrow\) reliability.Other_functions.stress_strength_normal
Bug Fixes
fixed a bug in Reliability_testing.reliability_test_duration in which certain inputs resulted in 1 failure and the plot limits caused a crash when left=right limit.
fixed a bug in ALT_Fitters where the CI string in the results title would be rounded to an integer. This would cause 0.975 to appear as 97% rather than 97.5%.
fixed a bug in Fit_Weibull_Mixture and Fit_Weibull_CR. When given input as a list of integers, it failed to convert these to floats and then crashed due to an error with type conversion error between int32 and float64
probability_plot_xylims had a bug when there is only 1 datapoint as xlower=xupper and ylower=yupper. Cases with only 1 datapoint are now handled appropriately.
Fitters had a bug where force_beta or force_sigma needed to be a float. It would crash if an int was supplied.
Fixed a bug in all the ALT fitters where a crash would occur when use level stress was not provided. This was due to the use life being referenced in all cases rather than just in cases where the use level stress was specified.
ROCOF had a bug that was only evident when the ROCOF was found to be constant. This was caused by a formula using n instead of n+1 for the sample size.
Other
Utils has 2 new functions (linear_regression and least_squares). These are now used by Fitters to obtain the least squares estimates.
The format of all the printed fitters outputs has been improved. More detail is provided, goodness of fit parameters are provided and the formatting is better.
Dataframes everywhere are formatted better to retain the index but not display it.
Text output for sample_size_no_failures.
Text output for one_sample_proportion.
Text output for two_proportion_test.
one_sample_proportion will now return 0 or 1 for the lower and upper reliability estimates instead of NaN in cases when there are all failures or all successes.
ALT_Fitters has 2 new results: alpha_at_use_stress (mu for Lognormal and Normal, Lambda for Exponential) and distribution_at_use_stress. These are provided for convenience and were able to be calculated from the previous results.
Title added to all nonparametric results printed.
Bold and underline enhancements to results titles in all ALT_fitters and in MCF_parametric and MCF_nonparametric.
Changed Build and Test from Travis CI to GitHub Actions.
Reformatted all code using Black. This resulted in a significant increase in the lines of code (LOC) count but in actual fact there was not that many new lines added.
Added another standard dataset called “mixture” and an ALT dataset called “ALT_temperature4”.
In all the ALT fitters, the initial guess process is now bypassed if an initial guess is specified by the user. Previously the initial guess was always obtained by curve_fit but not used if a user specified initial guess was given. This change enhances speed and enables a failure of curve_fit to be bypassed through specifying an accurate initial guess.
Documentation updates to reflect version 0.5.5 API changes and results printed.
Updated the Logo for reliability and provided the code for generating the new logo.
Changed the structure of the README to put the link to the documentation up higher.
Version: 0.5.4 — Released: 7 November 2020
Summary of changes
Version 0.5.4 of reliability brings in confidence intervals for many more distributions, as well as the inclusion of the Gumbel distribution. Due to the time it took to get the confidence intervals working, there have been many other minor changes to formatting of plots and printed results that are included in this release.
New features
Confidence intervals added for Normal, Lognormal, Loglogistic, and Gumbel Distributions. Confidence intervals for the Gamma and Beta Distributions will be part of 0.5.6 in Feb/Mar 2021
Added Gumbel_Distribution to Distributions
Added Gumbel_Distribution to Other_functions.distribution_explorer
Added Fit_Gumbel_2P to Fitters
Added Gumbel_probability_plot to Probability_plotting
Added Gumbel Distribution to Fitters.Fit_Everything
Added Gumbel Distribution to Other_functions.similar_distributions
Added Gumbel Distribution to Stress_strength.Probability_of_failure
Added Gumbel Distribution to Reliability_testing.chi2test and Reliability_testing.KStest
Added Loglogistic and Gumbel Distributions to PP_plot_parametric, QQ_plot_parametric, PP_plot_semiparametric, and QQ_plot_semiparametric. Loglogistic should have been added in version 0.5.3 but it was missed.
Added Loglogistic and Gumbel Distributions to Mixture Model and Competing Risks Model. Loglogistic should have been added in version 0.5.3 but it was missed.
Fit_Everything now plots everything in order of best fit for all 3 of the plots generated.
Both the Competing Risks Model and Mixture Model now work for negative xvals when the mixture contains one or more Normal and/or Gumbel Distributions. Previously these were be truncated at 0 which could lead to inaccuracies if the model contained Normal Distributions (or Gumbel Distributions, though Gumbel was not available previously).
API Changes
Confidence intervals were previously available for the Hazard functions of the Weibull and Exponential distributions. This capability has been removed as it was not useful (just as confidence intervals on the PDF are not useful). Any attempt to use confidence interval related keywords (such as CI and CI_type) on the HF of any distribution will generate an error.
Fit_Everything now includes an option to exclude distributions.
Fit_Expon_1P and Fit_Expon_2P are deprecated. These have been replaced by Fit_Exponential_1P and Fit_Exponential_2P. Using the old functions will still work and will issue a DeprecationWarning printed to the console. Full deprecation/removal will occur in March 2021 (in version 0.5.6). The reason for the change is to minimize the use of abbreviated terms. It was originaly abbreviated because the word Exponential_Distribution seemed too long, but this is no longer valid with Loglogistic_Distribution being added. Also, scipy’s function for Exponential is “expon” so Fit_Expon_1P initially seemed like an appropriate abbreviation.
percentiles have been added to all fitters (except Gamma and Beta). This will print a table of percentiles (with bounds on time) to the console. This is similar to the output that Minitab gives when fitting a distribution.
Bug Fixes
Other_functions.distribution_explorer had a bug caused by a recent update to matplotlib. When a non-existent axis was deleted, the error matplotlib generated was a ValueError and that is now changed to AttributeError which was not being appropriately handled by distribution_explorer.
All of the standard distributions expected a list or array for their 5 functions (PDF, CDF, SF, HF, CHF). A command like this “dist.SF(1)” would cause an error and should have been entered as dist.SF([1]). This is now fixed such that if the input is not in a list or array then it will no longer produce an error and the output type will be np.float64.
Within Fit_Everything if only 3 points were entered some of the AIC values would be ‘Insufficient Data’. If the user also specified sort_by=’AIC’ then an error would be raised by pandas trying to sort by strings and numbers. In this case the sort_by method will automatically be changed to BIC.
The Exponential confidence intervals were invisibe if there were only 2 failures for the fit. This was cause by the upper CI reaching 1 which is effectively infinity on a probability plot. 1’s are now filtered out so the CI will always appear.
Other
Removed margins in the stress_strength plots so that the xaxis coincides with the plot window.
Changed layout of Fitters.Fit_Everything probability plot and PP plot to be 4x3 without Beta fitted and 5x3 with Beta fitted. This was necessary to include the Gumbel Distribution in the space that Beta previously used.
Formatting changes to Fitters.Fit_Everything PP plot so the red line extends to the edges of the plot.
The histogram plot in Fitters.Fit_Everything now has its legend in the order of the the results, such that the best fitting distribution will appear first in the legend.
Within Other_functions.similar_distributions there were cases when a 3P distribution was fitted and the optimal gamma was 0 (making it the same as its 2P distribution). A filter has been added so the 3P distribution will only be shown if the gamma parameter is non-zero.
Improved plots for Stress_strength so the distribution xvals extend beyond the plot xlims. This is only noticable if the plot is moved.
Adjusted scaling and line colors for all QQ and PP plots to improve the way they are displayed.
PP_plot_parametric now has labels for quantile lines which are linked to the axes coords, so if the plot is moves / zoomed the labels will follow the plotting window.
Improved the Mixture Model PDF and HF using the actual formula rather than taking the numerical derivatives of CDF and CHF respectively.
Fit_Everything can now accept a minimum of 2 failures (previously the minimum was 3) and it will automatically exclude the 3P distributions
All warnings throughout reliability are now printed in red.
New Utils function colorprint. This provides a simple API for printing in color, bold, underline and italic.
Improved input checking for all the fitters. This has been standardised in a Utils function so nothing is missed for each of the fitters.
Probability_plotting.plot_points previously has a minimum of 2 failures required to plot the points. The minimum is now 1 failure required.
Version: 0.5.3 — Released: 29 September 2020
Summary of changes
Version 0.5.3 of reliability is a major release, adding in the Loglogistic distribution, the RankAdjustment nonparametric method, a new goodness of fit measure (anderson darling) and many other new functions.
New features
Added Loglogistic_Distribution to Distributions
Added Fit_Loglogistic_2P and Fit_Loglogistic_3P to Fitters
Added Loglogistic_probability_plot to Probability_plotting
Added Fit_Loglogistic_2P and Fit_Loglogistic_3P to Fitters.Fit_Everything
Added Loglogistic distribution to Other_functions.similar_distributions
Added Loglogistic distribution to Stress_strength.probability_of_failure
Added the function Reliability_testing.reliability_test_duration
Added the function Other_functions.distribution_explorer
Added Utils.probability_plot_xylims and Utils.probability_plot_xyticks which provide better axes limits and tick labels. These are now incorporated into all probability plots, ALT probability plots and ALT Fitters.
Added Chi-squared and Kolmogorov-Smirnov goodness of fit tests to Reliability_testing
Added Anderson-Darling goodness of fit test statistic into all Fitters (It is not approriate to use for ALT_fitters for the entire model). This now allows users to compare distributions goodness of fit using Log-likelihood, AICc, BIC, or AD. Note that the Anderson-Darling test statistic is the default goodness of fit test statistic in Minitab.
Added Utils.anderson_darling to simplify the process of calculating the AD statistic. It’s a lot of formulas that are best packaged into a function that is called by each of the Fitters.
Added Datasets.mileage which is a simple dataset with no right censored data.
Added Nonparametric.RankAdjustment. This method is similar in results to Kaplan-Meier and Nelson-Aalen but very different in the method used.
Other_functions.make_right_censored_data can now create either singly-censored or multiply-censored data. Previously it only created singly-censored data.
API Changes
Reliability_testing.reliability_test_planner has an optional argument of two_sided which was set to True as default. This has been changed to one_sided=True, making the default calculation use the one-sided confidence interval and changing the argument name. The reason for this change was to align the function with the approach more commonly used in industry.
All probability plots had h1 and h2 options for the plotting heuristics. These have been replaced by the argument “a” which is the same as what h1 was. h2 can be calculated from h1 and the length of the dataset so it was redundant. “a” was chosen to align with wikipedia.
Thanks to the addition of the Nonparametric.RankAdjustment, the functions Probability_plotting.QQ_plot_semiparametric and Probability_plotting.PP_plot_semiparametric now allow for ‘RA’ as the option in their method. Previously the methods were limited to ‘KM’, and ‘NA’ for Kaplan-Meier and Nelson-Aalen.
Other_functions.make_right_censored_data now has an additional argument of fraction_censored which controls the amount of data to right censor when producing multiply-censored data. There is also a random seed argument added for repeatability.
All the ALT_fitters were missing loglik as an output. They had loglik2 which is the same as loglik*-2 but this is added for completeness and to match the outputs from Fitters.
Bug Fixes
Fixed autoscale for cases where the HF is constant so it no longer lies along the yaxis upper limit
Fit_Everything had a bug in the default xvals for the Beta_Distribution’s histogram which caused an error in some special cases.
All the quantile functions in each distribution didn’t accept np.float64 and raised an error. They now accept this data type.
The AICc and BIC in all the ALT_fitters was slightly wrong due to a small coding error.
Other
Fixed the HF and CHF equations for Exponential_Distribution to be actual equations. The is preferred than using the HF = PDF/SF and CHF=-ln(SF) relationships which breakdown when SF=0 at high xvals. This has also been implemented for the loglogistic distribution. Can’t do it for Normal, Lognormal, Gamma, and Beta distributions as these do not have closed form solutions for HF and CHF which don’t involve the SF.
Changed the Gamma_Distribution and Weibull_Distribution mode to be self.gamma when beta < 1. Previously it was “No mode exists when beta < 1” which is true from a formula perspective but it is clear that the mode is equal to gamma as that’s where the asymptote occurs. The only distribution with “no mode exists…” is the Beta distribution as it can have 2 modes for certain values of alpha and beta.
Updated Utils.generate_X_array to use 200 points (rather than 100) and allocated more points to the right hand side of the plot (beyond b99). This was because plots were not displaying smoothly enough for distributions with high skewness.
Changed default plotting upper limit to b9999. Previously it was slightly more and was not a round quantile. Done for simplicity and minimal change will be noticed.
Changed the layout of the Probability plots and PP plots in Fit_Everything from a 5x2 grid to a 4x3 grid. This made more sense due to the addition of the Loglogistic Distribution which would have made the layout 6x2 which is too long.
Plotting enhancements to increase the detail in plots using less points (by generating more points where the plots curve and less where the plots are flat). Using 200 instead of 1000 points will make the plots much faster, particularly when multiple distributions are layered. In version 0.5.2 this was just done for the Weibull Distribution but it has now been implemented for all 7 of the standard probability distributions.
Plotting enhancements to the x and y scale such that the limits are based on the quantiles. This will ensure more relevant detail is shown, particularly for location shifted distributions. In version 0.5.2 this was just done for the done for Weibull Distribution but it has now been implemented for all 7 of the standard probability distributions.
Within Stress_strength.Probability_of_failure, the integration method has been changed from quad to trapz based on this issue.
Within Stress_strength the legend text for both plots no longer formats the probability of failure as a percentage and the format is changed to use scientific notation which is much more appropriate for very small failure probabilities.
Within Stress_strength both functions will issue a warning if stress.mean > strength.mean to indicate that the user may have assigned the distributions in the wrong order.
The version requirements for all dependancies have been updated to their most recent versions. This is most important for scipy which recently had an update that affects the covariance matrix results.
Added __version__ to the __init__.py file so that the version number is recorded in the same way as other packages record it.
Other_functions.histogram has an argument for bins. Previously this accepted the exact bins to be used and if left blank calculated them using the Freedman-Diaconis rule. In addition to accepting the exact bins to use, the bins argument now accepts strings just like matplotlib and numpy, and the default is now ‘auto’. See numpy for more detail on the strings available.
KaplanMeier and NelsonAalen now consider previous xlim when plotting. This prevents plot limits from being overridden by the most recent plot.
Version: 0.5.2 — Released: 14 August 2020
Summary of changes
Version 0.5.2 of reliability includes two special distributions, the mixture distribution and the competing risks distribution, along with their respective fitters. Autoscaling is also a great improvement to ensure that plots appear mostly the same, just with their axes scaled appropriately.
New features
New distributions
Mixture_Distribution
Competing_Risks_Distribution
A new fitter for the Weibull competing risks model (Fit_Weibull_CR)
The output of the Fit_Weibull_Mixture now includes a probability plot instead of a histogram of the PDF and CDF
The output of the Fit_Weibull_Mixture now prints the confidence interval estimates of the parameters
Added some datasets for use with the mean cumulative function (MCF_1 and MCF_2).
API Changes
Within Fitters.Fit_Weibull_mixture the option show_plot has been changed to show_probability_plot to align with all the other fitters.
Bug Fixes
Fixed the autoscale in Weibull and Exponential distributions that locked autoscaling when confidence intervals were plotted sequentially.
Automatic removal of zeros for all fitters (except Normal_2P). Previously the zeros were left in the data and resulted in NaNs and crashes. Also added a dedicated error to report input with times below zero.
Fixed the confidence interval bounds for Kaplan-Meier and Nelson-Aalen CHF plots. Some of the bounds were inf since the CHF = -ln(SF) which will be inf when SF=0.
MCF_Nonparametric and MCF_Parametric had a bug which caused crashes when the dataset included a system with only one censored time. This has now been fixed.
Other
Minor clean up of code. Removed unnecessary imports, removed unused variables, etc. Hopefully this will have no noticable effects.
Within Fitters.Fit_Everything the histogram output has been improved with better formatting and it now uses the Freedman-Diaconis rule for obtaining optimal bin width.
Fixed Weibull HF and CHF equations to use actual equations and not PDF/SF or -ln(SF) as these result in NaN when SF=0 (an issue at high xvals). These changes are currently only implemented for Weibull_Distribution.
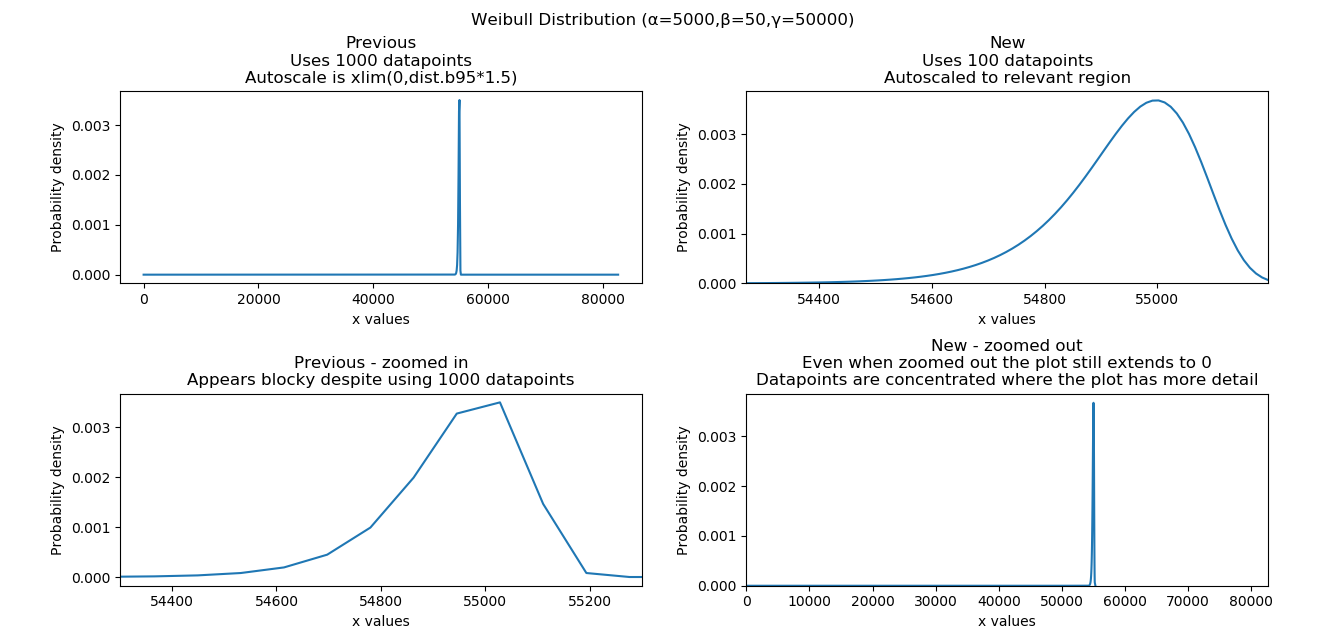
Improved creation of xvals for PDF,CDF,SF,HF,CHF within the Weibull Distribution. The changes now generate datapoints where there is more detail (between the 0.1% and 99.9% quantiles) such that only 100 datapoints are needed to show more detail than was previously achieved with 1000 datapoints. This is most noticable with Weibull distributions that have high beta values and are significantly location shifted. An example of this is shown in the plot below. These changes are only implemented for Weibull_Distribution but will be extended to all distributions in the very near future.
Improved autoscaling for the Weibull Distribution plots. For location shifted distributions, this zooms in on the 0.1% to 99.9% quantiles allowing users to see more detail. The HF and CHF ylimits are also limited based on the quantiles so that they do not obscure the detail if there is an asymptote to large values or infinity. An example of this is shown in the plot below. These changes are only implemented for Weibull_Distribution but will be extended to all distributions in the very near future.
Version: 0.5.1 — Released: 08 July 2020
Summary of changes
Version 0.5.1 of reliability is a fairly minor release.
New features
More efficient method used within Other_functions.similar_distributions. Results are always consistent and more accurate now.
Other_functions.histogram. This plots a histogram with optimal bin width, better default formatting, and an option to shade bins white above a threshold.
API Changes
Some of the functions in reliability.Other_functions have been moved into reliability.Utils and reliability.Reliability_testing. The new layout is:
Utils \(\Rightarrow\) round_to_decimals, transform_spaced, axes_transforms
Other_functions \(\Rightarrow\) similar_distributions, convert_dataframe_to_grouped_lists, crosshairs, make_right_censored_data
Reliability_testing \(\Rightarrow\) one_sample_proportion, two_proportion_test, sample_size_no_failures, sequential_sampling_chart, reliability_test_planner
Within Other_functions.similar_distributions the option ‘monte_carlo_trials’ has been removed as the distribution sampling method is no longer random.
Bug Fixes
Fixed confidence interval color inheritance for Nonparametric.Kaplan_Meier and Nonparametric.Nelson_Aalen. Previously the color was only inherited if specified rather than left as default.
The default axes labels for both Stress_strength.Probability_of_failure and Stress_strength.Probability_of_failure_normdist were reversed. The have now been switched to the correct labels.
Other
Documentation updates to reflect the API changes in Version 0.5.1
Version: 0.5.0 — Released: 04 July 2020
Summary of changes
Version 0.5.0 of reliability is a major release that includes the first introduction of confidence intervals, and many other new features. Significant structural changes have also been made including the use of a Utils function and the the introduction of automated testing.
New features
Confidence intervals on fitted distributions ==> this has only been implemented for Weibull and Exponential. Is is quite difficult and takes considerable time and testing. I will do Normal and Lognormal distributions next, then Gamma and Beta distributions. I hope to finish them all by September 2020.
Confidence intervals have been disabled in in ALT_probability_plotting and ALT_fitters to avoid cluttering on the plot.
The probability plot in Fit_Everything now uses the Exponential_probability_plot_Weibull_Scale instead of Exponential_probability_plot. It is much clearer to see the effectiveness of the fit using the Weibull scale.
Added an option to seed the random_samples functions within the Distributions module. This allows for repeatable results.
Improvements to rounding of all titles, labels, and stats in Distributions and Probability_plotting using a new function, round_to_decimals.
Added Other_functions.round_to_decimals which keeps the specified number of decimals after leading zeros. This is useful as round would make very small values appear as 0.
Minor improvements to color inheritance for probability_plotting.
Minor improvements to confidence interval color inheritance for Nonparametric.Kaplan_Meier and Nonparametric.Nelson_Aalen.
Within Stress_strength, the method of obtaining the solution has been changed from monte carlo to integration. Thanks to Thomas Enzinger for providing the formula for this method in response to an Issue that was raised. Using the integration method, accuracy is much higher (1e-11 error now vs 1e-3 error previously) and always consistent, and the speed is significantly improved over the monte carlo method. As noted below in API changes, there is no need to specify the number of monte_carlo_samples and no option to obtain the convergence plot.
Within Stress_strength, the colors used for shading have been changed to improve the style.
Probability_plotting.plot_points now includes the option to plot the points for the PDF and HF. These are not very useful as they appear messy due to the discontinuous nature of the function, but they are added for completeness.
Added Other_functions.transform_spaced. This is similar to np.linspace and np.logspace but it creates an array that is ‘weibull spaced’, ‘normal spaced’, ‘exponential spaced’, ‘beta spaced’, or ‘gamma spaced’. It is used to get data points for the confidence intervals so they are as evenly spaced as possible, particularly on probability paper. This function is likely to be moved into utils.
Other_functions.make_right_censored_data has been added. This function accepts uncensored data and a threshold, and returns failures and right_censored arrays.
Added mplcursors to requirements in setup.py as it is needed for the crosshairs function.
Added crosshairs function to Other_functions. This is a very useful feature that provides interactive crosshairs to the plot using snap-to feature and also adds annotations on click events. Thanks to Antony Lee (the author of mplcursors) for help with getting this to work using his library.
Bug fixes
Within Stress_strength, there are improvements to the fill_between method as it had errors in some special cases.
Fixed an Issue in Lognormal_Probability_Plot that occurred for very large numbers (above 1e20)
API Changes
Within Stress_strength, the output format has changed from an object to a returned value of the probability of failure. This makes it much more simple to access the answer since the object had only one value.
Within Stress_strength, the method of obtaining the solution has been changed from monte carlo to integration. As a result, there is now no need to specify the number of monte_carlo_samples and no option to obtain the convergence plot.
Added the options initial_guess_method and optimizer to Fit_Weibull_2P and Fit_Weibull_3P. They were previously only in Fit_Weibull_2P_grouped. It is planned to add these options to all fitters.
There is now the option CI_type for the Weibull and Exponential fitters. This allows users to chose between confidence bounds on reliability and time. This option will be added to all fitters as the confidence intervals for the other distributions are completed.
Other
Added tests folder. This is planned to include automated tests.
Created utils module. I plan to move some utilities into here that are currently inside other modules where users can access them, but users should never need to access them so they just create clutter in the dropdown lists of your IDE.
Added Reliability_testing module. I plan to move everything related to reliability testing out of Other_functions as there is now enough functions to justify a new module dedicated to reliability testing.
Documentation updates to reflect the changes in Version 0.5.0
Version: 0.4.9 — Released: 27 April 2020
New features
Updates to reliability_test_planner to include option for failure terminated test
Other
Addition of this Changelog to the documentation