Fitting all available distributions to data
API Reference
For inputs and outputs see the API reference.
To fit all of the distributions available in reliability, is a similar process to fitting a specific distribution. The user needs to specify the failures and any right censored data. The Beta distribution will only be fitted if you specify data that is in the range 0 to 1 and does not include confidence intervals on the plot. The selection of what can be fitted is all done automatically based on the data provided. Manual exclusion of probability distributions is also possible. If you only provide 2 failures then all distributions with more than 2 parameters will automatically be excluded from the fitting process.
Confidence intervals are shown on the plots but they are not reported for each of the fitted parameters as this would be a large number of outputs. If you need the confidence intervals for the fitted parameters you can repeat the fitting using just a specific distribution and the results will include the confidence intervals. Confidence intervals are not yet available for the Weibull DS, Weibull Mixture, and Weibull CR models.
The distributions Weibull_ZI and Weibull_DSZI are not included when using Fit_Everything as these distributions are only applicable when the dataset contains zeros. If your data contains zeros you should fit these distributions individually.
Example 1
In this first example, we will use Fit_Everything on some data and will return only the dataframe of results. Note that we are actively supressing the 4 plots that would normally be shown to provide graphical goodness of fit indications. The table of results has been ranked by BIC to show us that Weibull_2P was the best fitting distribution for this dataset. This is what we expected since the data was generated using Weibull_Distribution(alpha=50,beta=2).
from reliability.Fitters import Fit_Everything
# data created using Weibull_Distribution(alpha=50,beta=2), and rounded to nearest integer
data = [92, 44, 94, 56, 54, 24, 96, 3, 27, 37, 61, 23, 70, 101, 21, 47, 4, 34, 10, 88, 37, 86, 62, 70, 21, 13, 47, 21, 57, 36, 43, 83, 42, 16, 20, 44, 43, 50, 35, 51, 35, 49, 60, 22, 34, 41, 53, 27, 44, 49]
Fit_Everything(failures=data, show_histogram_plot=False, show_probability_plot=False, show_PP_plot=False, show_best_distribution_probability_plot=False)

'''
Results from Fit_Everything:
Analysis method: MLE
Failures / Right censored: 50/0 (0% right censored)

   Distribution   Alpha    Beta  Gamma Alpha 1  Beta 1 Alpha 2  Beta 2 Proportion 1 DS      Mu   Sigma    Lambda  Log-likelihood    AICc     BIC       AD optimizer
     Weibull_2P 51.1908 1.92376                                                                                         -228.338 460.932 464.501 0.613083       TNC
       Gamma_2P 16.5098 2.75836                                                                                         -229.902  464.06 467.628 0.779371       TNC
     Weibull_CR                         52.292 1.78639 98.2941  27.141                                                  -226.049 460.987 467.746 0.654939       TNC
     Weibull_3P 51.1908 1.92376      0                                                                                  -228.338 463.198 468.413 0.613083       TNC
     Weibull_DS 51.1908 1.92376                                                      1                                  -228.338 463.198 468.413 0.613083       TNC
      Normal_2P                                                                          45.54 24.2959                  -230.462  465.18 468.748 0.967238       TNC
Weibull_Mixture                        44.0526 2.21658 94.6341 17.6943     0.880535                                     -225.092 461.547 469.744  0.61163       TNC
       Gamma_3P 16.5098 2.75836      0                                                                                  -229.902 466.326  471.54 0.779371       TNC
 Loglogistic_2P 40.6775 2.72212                                                                                         -232.426 469.108 472.677 0.754563       TNC
 Loglogistic_3P 40.6775 2.72212      0                                                                                  -232.426 471.374 476.589 0.754563       TNC
   Lognormal_2P                                                                        3.62651  0.7149                  -235.492 475.239 478.808  1.52542       TNC
      Gumbel_2P                                                                        58.2756 25.7469                  -237.148 478.551  482.12  2.19655       TNC
   Lognormal_3P                      0                                                 3.62651  0.7149                  -235.492 477.505  482.72  1.52542       TNC
 Exponential_2P                 2.9999                                                                 0.0235072        -237.522   479.3 482.869  4.27822       TNC
 Exponential_1P                                                                                        0.0219587         -240.93 483.942 485.771  5.05245       TNC
'''
Example 2
In this second example, we will create some right censored data and use Fit_Everything. All outputs are shown, and the best fitting distribution is accessed and printed.
from reliability.Fitters import Fit_Everything
from reliability.Distributions import Weibull_Distribution
from reliability.Other_functions import make_right_censored_data
raw_data = Weibull_Distribution(alpha=12, beta=3).random_samples(100, seed=2) # create some data
data = make_right_censored_data(raw_data, threshold=14) # right censor the data
results = Fit_Everything(failures=data.failures, right_censored=data.right_censored) # fit all the models
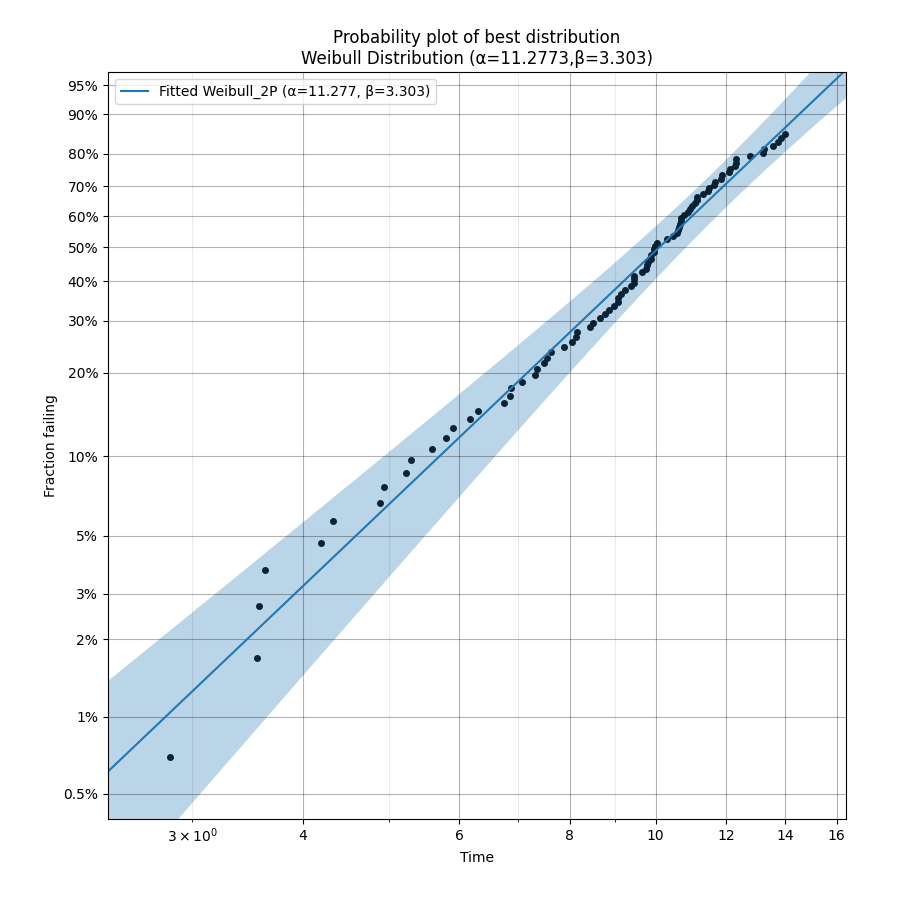
print('The best fitting distribution was', results.best_distribution_name, 'which had parameters', results.best_distribution.parameters)
'''
Results from Fit_Everything:
Analysis method: MLE
Failures / Right censored: 86/14 (14.0% right censored)
Distribution Alpha Beta Gamma Alpha 1 Beta 1 Alpha 2 Beta 2 Proportion 1 DS Mu Sigma Lambda Log-likelihood AICc BIC AD optimizer
Weibull_2P 11.2773 3.30301 -241.959 488.041 493.128 44.945 TNC
Normal_2P 10.1194 3.37466 -242.479 489.082 494.169 44.9098 TNC
Gamma_2P 1.42301 7.21417 -243.235 490.594 495.68 45.2817 TNC
Loglogistic_2P 9.86245 4.48433 -243.588 491.301 496.387 45.2002 TNC
Weibull_DS 10.7383 3.57496 0.930423 -241.594 489.437 497.003 44.9447 TNC
Weibull_3P 10.0786 2.85824 1.15083 -241.779 489.807 497.373 44.9927 TNC
Weibull_Mixture 3.59763 113.232 11.4208 3.54076 0.0276899 -237.392 485.421 497.809 44.9283 TNC
Gamma_3P 1.42301 7.21417 0 -243.235 492.72 500.286 45.2817 TNC
Lognormal_2P 2.26524 0.406436 -245.785 495.694 500.78 45.6874 TNC
Loglogistic_3P 9.86245 4.48433 0 -243.588 493.427 500.992 45.2002 TNC
Weibull_CR 12.72 3.30301 15.8031 3.30301 -241.959 492.338 502.338 44.945 TNC
Lognormal_3P 0 2.26524 0.406436 -245.785 497.82 505.385 45.6874 TNC
Gumbel_2P 11.5926 2.94944 -248.348 500.819 505.906 45.4624 L-BFGS-B
Exponential_2P 2.82892 0.121884 -267.003 538.129 543.216 51.7852 TNC
Exponential_1P 0.0870024 -295.996 594.034 596.598 56.8662 TNC
The best fitting distribution was Weibull_2P which had parameters [11.27730641 3.30300712 0. ]
'''
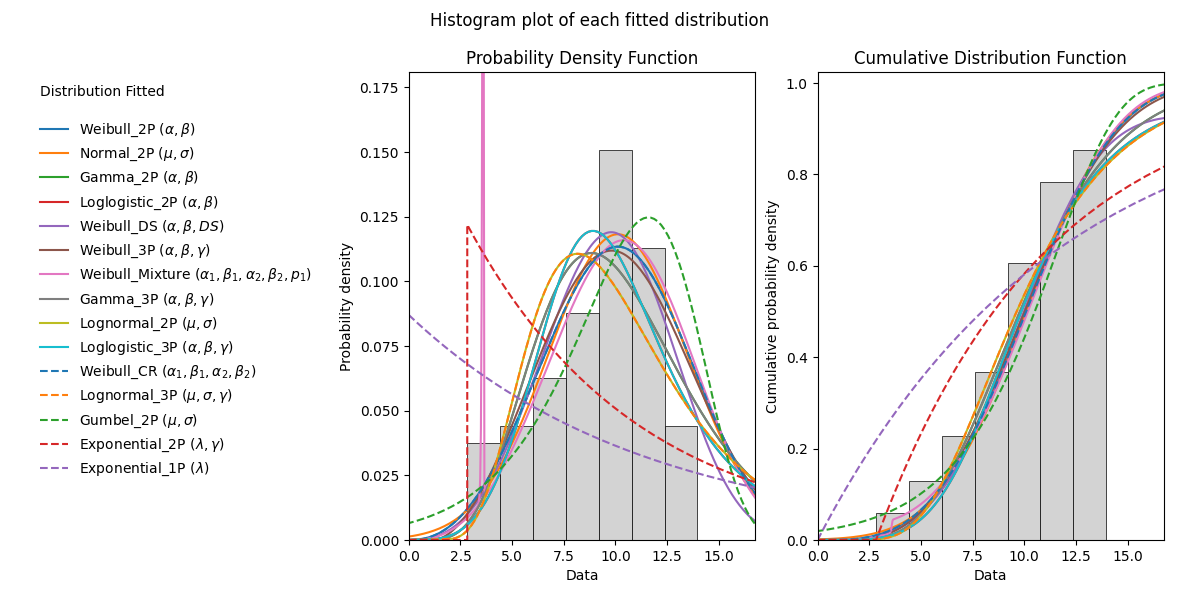
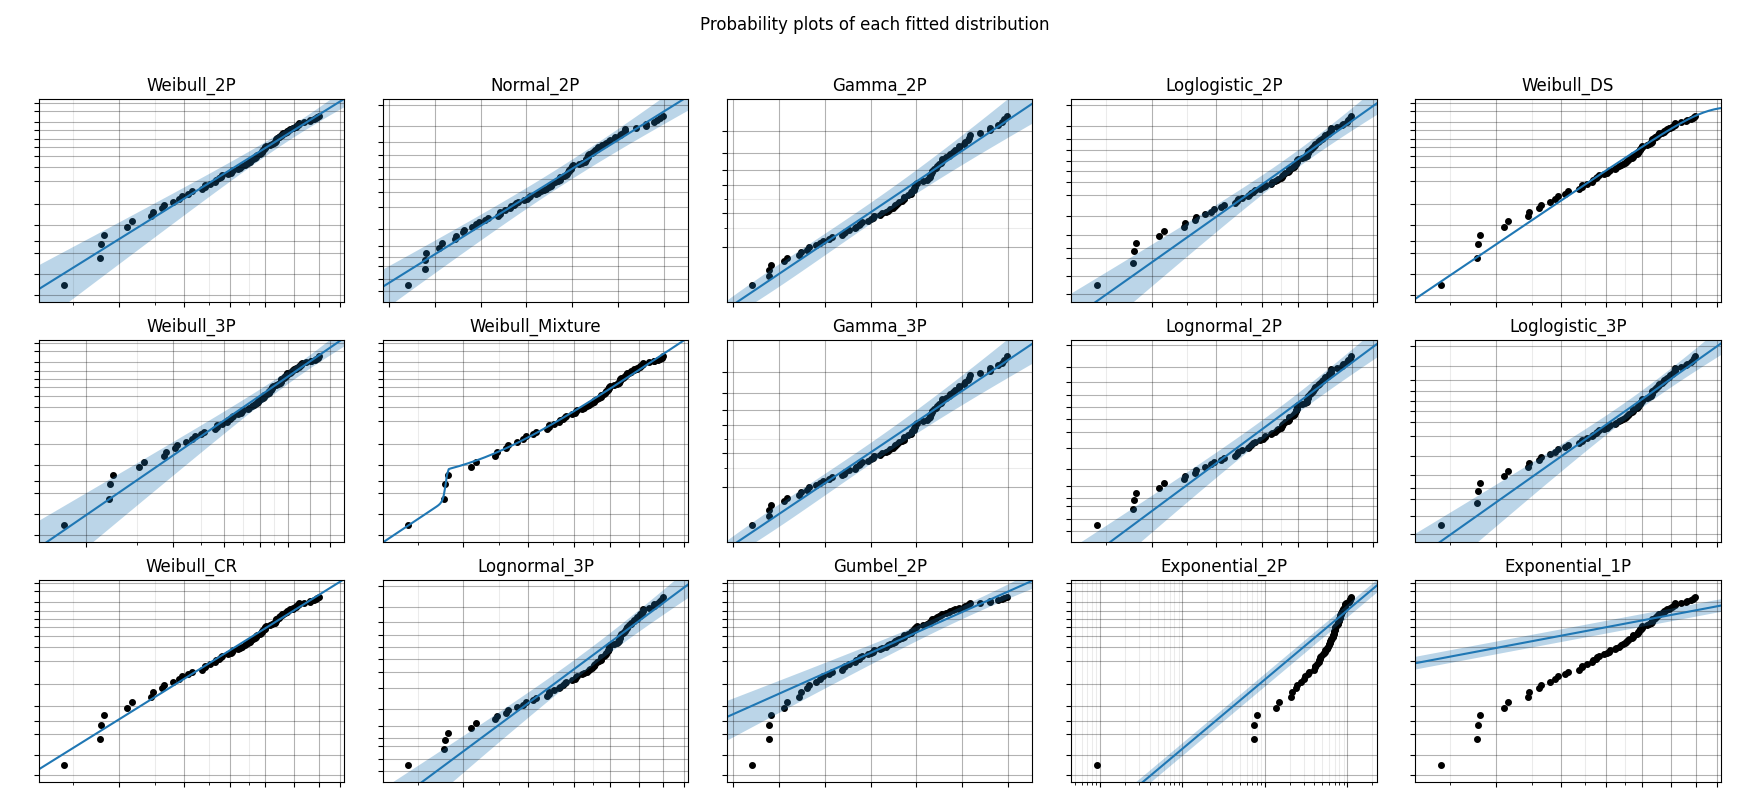
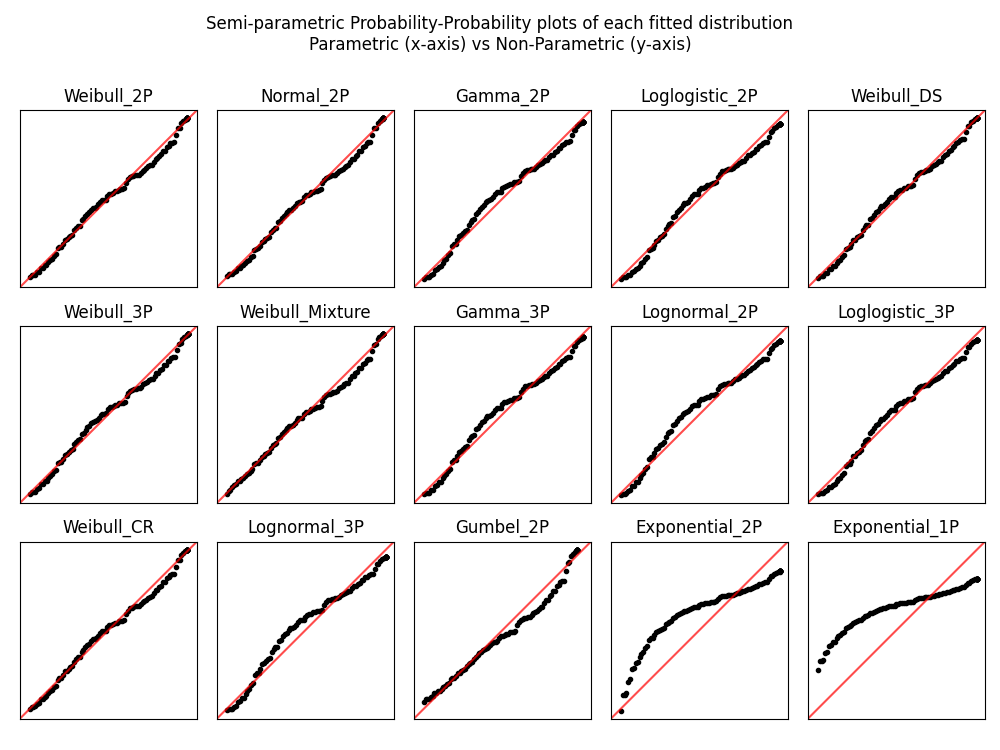
All plots are ordered based on the goodness of fit order of the results. For the histogram this is reflected in the order of the legend. For the probability plots and PP plots, these are ordered from top left to bottom right.