Nelson-Aalen
API Reference
For inputs and outputs see the API reference.
The Nelson-Aalen estimator provides a method to estimate the hazard function of a population without assuming that the data comes from a particular distribution. From the hazard function, the Nelson-Aalen method obtains the cumulative hazard function, which is then used to obtain the survival function. Due to the lack of parameters required in this model, it is a non-parametric method of obtaining the survival function. As with the Kaplan-Meier estimator, once we have the survival function (SF), then we also have the cumulative hazard function (CHF) and the cumulative distribution function (CDF). It is not possible to obtain a useful version of the probability density function (PDF) or hazard function (HF). While the hazard function is obtained directly by the Nelson-Aalen method, it is a useless function on its own as it is a very spikey plot due to the non-continuous nature of the hazard. It is only when we smooth the results out using the cumulative hazard function that we obtain some utility from the results.
The Nelson-Aalen estimator is very similar in result (but quite different in method) to the Kaplan-Meier estimator and Rank Adjustment estimator. While none of the three have been proven to be more accurate than the others, the Kaplan-Meier estimator is generally more popular as a non-parametric means of estimating the SF. Confidence intervals are provided using the Greenwood method with Normal approximation.
The Nelson-Aalen estimator can be used with both complete and right censored data. This function can be accessed from reliability.Nonparametric.NelsonAalen as shown in the examples below.
Example 1
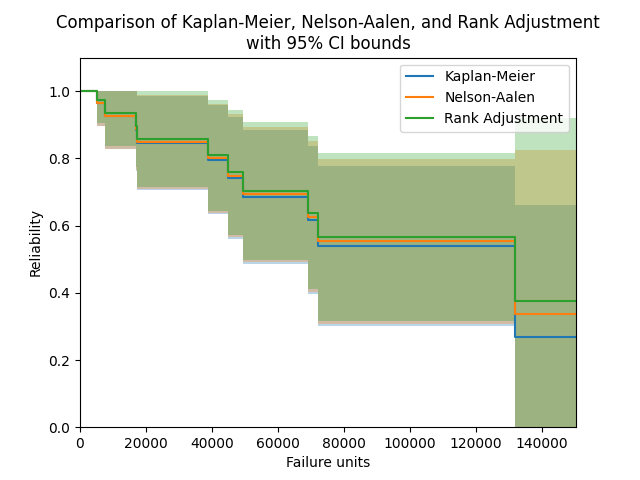
In the example below, we will compare the results from the Nelson-Aalen estimator with the results from the Kaplan-Meier estimator and Rank Adjustment estimator. We will also extract the column of point estimates from the results and print these for each method in a dataframe.
  from reliability.Nonparametric import KaplanMeier, NelsonAalen, RankAdjustment
  import matplotlib.pyplot as plt
  import pandas as pd

  failures = [5248, 7454, 16890, 17200, 38700, 45000, 49390, 69040, 72280, 131900]
  censored = [3961, 4007, 4734, 6054, 7298, 10190, 23060, 27160, 28690, 37100, 40060, 45670, 53000, 67000, 69630, 77350, 78470, 91680, 105700, 106300, 150400]
  KM = KaplanMeier(failures=failures, right_censored=censored, label='Kaplan-Meier', print_results=False)
  NA = NelsonAalen(failures=failures, right_censored=censored, label='Nelson-Aalen', print_results=False)
  RA = RankAdjustment(failures=failures, right_censored=censored, label='Rank Adjustment', print_results=False)

  plt.title('Comparison of Kaplan-Meier, Nelson-Aalen, and Rank Adjustment\nwith 95% CI bounds')
  plt.legend()

  # print a table of the SF estimates for each method
  data = {'Kaplan-Meier': KM.KM, 'Nelson-Aalen': NA.NA, 'Rank Adjustment': RA.RA}
  df = pd.DataFrame(data, columns=['Kaplan-Meier', 'Nelson-Aalen', 'Rank Adjustment'])
  print(df)

  plt.show()

'''
    Kaplan-Meier  Nelson-Aalen  Rank Adjustment
0       1.000000      1.000000         1.000000
1       1.000000      1.000000         1.000000
2       1.000000      1.000000         1.000000
3       0.964286      0.964916         0.974412
4       0.964286      0.964916         0.974412
5       0.964286      0.964916         0.974412
6       0.925714      0.927081         0.936568
7       0.925714      0.927081         0.936568
8       0.885466      0.887637         0.897146
9       0.845217      0.848193         0.857724
10      0.845217      0.848193         0.857724
11      0.845217      0.848193         0.857724
12      0.845217      0.848193         0.857724
13      0.845217      0.848193         0.857724
14      0.795499      0.799738         0.809542
15      0.795499      0.799738         0.809542
16      0.742465      0.748161         0.758348
17      0.742465      0.748161         0.758348
18      0.685353      0.692768         0.703498
19      0.685353      0.692768         0.703498
20      0.685353      0.692768         0.703498
21      0.616817      0.626842         0.638675
22      0.616817      0.626842         0.638675
23      0.539715      0.553186         0.566650
24      0.539715      0.553186         0.566650
25      0.539715      0.553186         0.566650
26      0.539715      0.553186         0.566650
27      0.539715      0.553186         0.566650
28      0.539715      0.553186         0.566650
29      0.269858      0.335524         0.374582
30      0.269858      0.335524         0.374582
'''
Further examples are provided in the documentation for the Kaplan-Meier estimator as this function is written to work exactly the same way as the Nelson-Aalen estimator.