Histogram
This function plots a histogram using the matplotlib histogram (plt.hist()), but adds some additional features. Default formatting is improved, the number of bins is optimized by default, and there is an option to shade the bins white above a chosen threshold. If you would like to specify the number of bins rather than having the optimal number calculated, then the bins argument allows this.
API Reference
For inputs and outputs see the API reference.
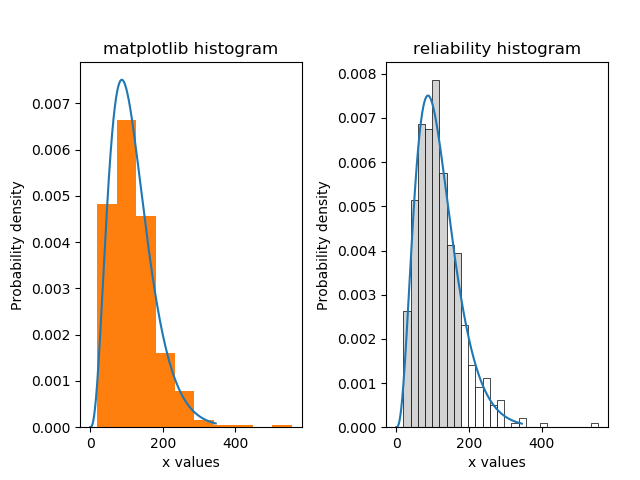
The following example shows the difference between the appearance of the default histogram in matplotlib, and the histogram in reliability.
from reliability.Distributions import Gamma_Distribution
from reliability.Fitters import Fit_Gamma_2P
from reliability.Other_functions import make_right_censored_data, histogram
import matplotlib.pyplot as plt

a = 30
b = 4
threshold = 180  # this is used when right censoring the data
dist = Gamma_Distribution(alpha=30, beta=4)
raw_data = dist.random_samples(500, seed=2)  # create some data. Seeded for repeatability
data = make_right_censored_data(raw_data, threshold=threshold)  # right censor the data
gf = Fit_Gamma_2P(failures=data.failures,right_censored=data.right_censored,show_probability_plot=False,print_results=False)

plt.subplot(121)
gf.distribution.PDF()
plt.hist(raw_data, density=True) # default histogram from matplotlib
plt.title('matplotlib histogram')

plt.subplot(122)
gf.distribution.PDF()
histogram(raw_data, white_above=threshold) # histogram from reliability - better formatting, optimal bin width by default, white_above option
plt.title('reliability histogram')

plt.subplots_adjust(right=0.95, wspace=0.38)
plt.show()