Crosshairs
This function provides interactive crosshairs on matplotlib plots. The crosshairs will follow the users’ mouse cursor when they are near lines or points and will snap to these lines and points. Upon a mouse click the crosshairs will add an annotation to the plot. This annotation can be dragged to a new position. To delete the annotation, right click on it. To temporarily hide all annotations, toggle ‘h’ on your keyboard.
Note that crosshairs should be called after everything is added to the plot (but before plt.show()) so that the objects in the plot are identified for the ‘snap to’ feature. If something is added to the plot after calling crosshairs then you will not be able to move the crosshairs onto it.
If your interactive development environment does not generate the plot in its own window then your plot is not interactive and this will not work. For iPython notebook users, the interactive window should be available by typing “%matplotlib qt” after importing matplotlib as described here.
There are some customisable attributes of the crosshairs and annotations as described in the API reference.
API Reference
For inputs and outputs see the API reference.
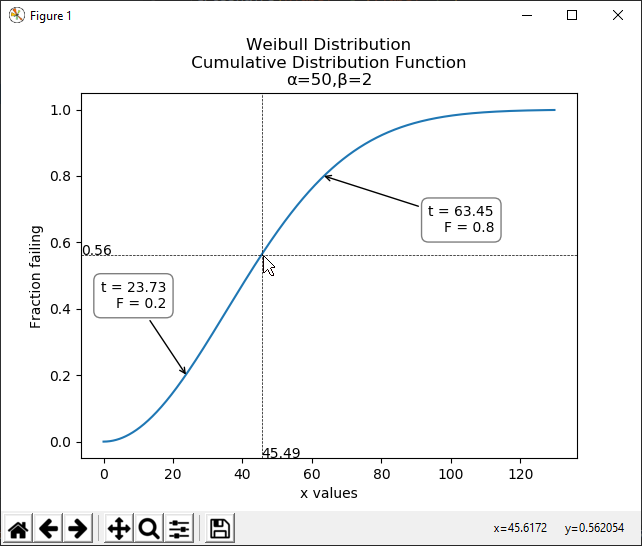
In the following example, we see the crosshairs being used to display the value of the Weibull CDF. The dynamic nature of this feature is shown in the video at the bottom of this page.
from reliability.Other_functions import crosshairs
from reliability.Distributions import Weibull_Distribution
import matplotlib.pyplot as plt

Weibull_Distribution(alpha=50,beta=2).CDF()
crosshairs(xlabel='t',ylabel='F') #it is important to call this last
plt.show()
A special thanks goes to Antony Lee, the author of mplcursors. The crosshairs function works using mplcursors to enable the ‘snap to’ feature and the annotations. Antony was very helpful in getting this to work.